30 January 2012

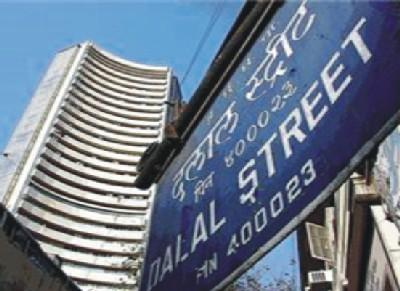
Foreigners light up Dalal Street as locals keep away :Business Standard,

Please Share:: Bookmark and Share India Equity Research Reports, IPO and Stock News
Visit http://indiaer.blogspot.com/ for complete details �� ��


A gush of liquidity from foreign investors has suddenly changed the fortunes of Indian shares, making the Bombay Stock Exchange (BSE) Sensex the best performing index among global peers since the calendar year began.
After losing a quarter of its value in 2011, the Bombay Stock Exchange (BSE) benchmark, the Sensex, has gained 11.5 per cent this far in January.
The 30-stock index last closed at 17,233.98.

India among top five countries for investors (Business Standard, rediff)

Please Share:: Bookmark and Share India Equity Research Reports, IPO and Stock News
Visit http://indiaer.blogspot.com/ for complete details �� ��


China is the largest competitor of India in terms of attractiveness.

India has something to cheer, amidst the global slowdown fears. The Ernst & Young's 2012 India Attractiveness Survey says investors view India as an attractive investment destination.
In the survey's global ranking, India is the fourth destination for foreign direct investment just below the United States, China and Britain.
China is the largest competitor of India in terms of attractiveness, according to the survey.
The three most attractive characteristics of the Indian market that attract investors include high potential of the domestic market driven by an emerging middle class, cost competitiveness and access to a highly qualified workforce.

GSFC Reco: ACCUMULATE CMP: Rs 388 Target Price: Rs 530 :Emkay,

Please Share:: Bookmark and Share India Equity Research Reports, IPO and Stock News
Visit http://indiaer.blogspot.com/ for complete details �� ��


Result Update

GSFC

Reco: ACCUMULATE

CMP: Rs 388

Target Price: Rs 530

Results inline; maintain Accumulate
·      GSFC reported in line performance- sales of Rs 13bn, 6% yoy, APAT of Rs 1.7bn, -15% yoy. EBITDA margins declined 590bps yoy/410bps qoq to 19.8% due to lower chemical margins

·      Fertiliser EBIT margin at 15.3% (est 13%) was ahead of est while chemical margin at 26.6% (est 28%)was lower than est. Decline in chemical margins is in line with decline in spreads

·      Caprolactam-benzene spread bounced back to $1710/mt in Jan'12 compared to low of $1480/mt in Dec’11. However, est remain unchanged as we had factored spreads of $1700/mt

·      Earnings have started decelerating from Q3FY12 due to decline in spreads. We maintain Accum with TP of Rs 530 despite attractive valuations due to declining trend in spread

Fidelity in talks to sell India mutual fund business-reuters

Please Share:: Bookmark and Share India Equity Research Reports, IPO and Stock News
Visit http://indiaer.blogspot.com/ for complete details �� ��


  • Fidelity seeking a valuation of $202 million - report
  • Large number of MFs including Goldman Sachs unit likely to bid
  • Fidelity managed assets worth $1.8 billion as of end-Dec
Fidelity Investments is in talks to sell its India mutual fund business and is seeking a valuation of 10 billion rupees ($202 million) for the unit, a report on the Economic Times website said citing a person with direct knowledge of the development.

Fidelity's India fund management arm, which was launched in 2004, may attract interest from a large number of fund houses including Goldman Sachs' asset management unit, said the report.

Advisors representing Fidelity circulated a "request for proposal" to companies interested in buying the asset last week, it said.

The fund manager may retain a small team in India that will advise investors on its India-focused offshore funds, the report said.

A spokesman for Fidelity's asset management arm in India did not immediately respond to a mail from Reuters seeking comment.

Fidelity managed assets worth about 88 billion rupees ($1.8 billion) as of end-December 2011, according to data from the Association of Mutual Funds in India, making it the 15th largest company in India's competitive asset management business.

The company's average assets under management has slightly fallen from 91 billion rupees at the beginning of the last year, the data showed, with India's main market index posting a drop of nearly 25 percent in 2011.

Assets managed by fund managers in India rose to 5.9 trillion rupees ($119 billion) as of March 2011 from 2.3 trillion in March 2006, according to a study by research and consultancy company PricewaterhouseCoopers.

Lured by the long-term prospects of Asia's third-largest economy, overseas fund managers, such as U.S.-based T. Rowe Price Group Inc and Fidelity, have been buying into Indian money managers or setting up operations on their own.

Nippon Life Insurance earlier this month agreed to pay $290 million for a 26 percent stake in the asset management unit of Indian financial services provider Reliance Capital Ltd .

Wall Street bank Goldman Sachs last year bought India's Benchmark Asset Management Co, which managed about $700 million in assets at that time.

However, the sharp fall in the equity markets and the recent regulatory changes such as the removal of the entry load, or a commission charged by a mutual fund distributor for selling a product, has added to the competitive pressure in the sector.

Q3FY12 Result Update Pfizer Buy Target Price: Rs1,483 ::Centrum

Please Share:: Bookmark and Share India Equity Research Reports, IPO and Stock News
Visit http://indiaer.blogspot.com/ for complete details �� ��


Q3FY12 Result Update
Pfizer

Buy
Target Price: Rs1,483
CMP: Rs1,224
Upside: 21%
Lower sales growth, better margins
Pfizer’s Q3FY12 numbers were below our expectations due to 4%YoY sales growth. The company’s EBIDTA margin improved by 70bps and net profit grew by 11%YoY. Pfizer has realigned its marketing team with the addition of 200 MRs from Wyeth and created a new marketing team for the diabetes segment. The recently introduced insulin brands are doing well in the domestic market. Pfizer has established a 100% subsidiary to hive off its animal healthcare (AHC) business in line with the global re-structuring of AHC business.  We reiterate Buy with a target price of Rs1483 (based on 19x FY13 EPS).
m  Lower sales growth of pharma division: During the quarter, Pfizer reported 4%YoY growth in total revenues from Rs2.61bn to Rs2.71bn due to lower sales from the pharma division. The results are strictly not comparable as the previous quarter ended Nov’10. Pharma sales (81% of revenues) grew by 6%YoY from Rs2.06bn to Rs2.18bn. AHC sales (12% of revenues) grew by 13%YoY from Rs302mn to Rs340mn. However, clinical services (7% of revenues)  revenues declined by 27%YoY from Rs249mn to Rs183mn.
m  Margin improves by 70bpsPfizer reported 70 bps YoY improvements in EBIDTA margin from 18.5% to 19.2% mainly due to the decline in material cost and other expenses. Its material cost declined by 240bps YoY from 32.8% to 30.4% of total revenues due to the change in product mix. Its personnel cost increased by 270bps YoY from 15.1% to 17.8% of total revenues due to the addition of field force and transfer of 200 MRs from Wyeth. Pfizer’s other expenses declined by 100bps YoY from 33.6% to 32.6% due to improvement in productivity of field force. The company’s net profit grew by 11%YoY from Rs436mn to Rs483mn due to margin improvement & rise in other income.
m  Good upside from insulin products: Pfizer has successfully launched two insulin brands in the domestic market. The company sources these products from Biocon. Pfizer has created a dedicated field force for the anti-diabetic segment and has plans to launch more products in this segment. It is also giving a thrust to its hospital business and rural marketing.
m  Growing in line with the market: As per IMS MAT-November’11, Pfizer grew by 14% in line with the market growth of 14%. Eight of the company’s products appear in the list of top 300 brands in the domestic market. Pfizer’s Lyrica and Claribid grew by 28% and 37% respectively in the domestic market.
m  Hives off AHC business:  In line with the international re-structuring to focus on pharma business, Pfizer has created a 100% subsidiary to hive off its AHC business. The AHC business contributes around 12% to the consolidated revenues.
m  Merger with Wyeth: In line with the international merger, Wyeth would merge with Pfizer in India. The merged company would rank 9th in the domestic market and 4th among MNC pharma companies in India. The merged company would have 13 products in the top 300 products (8 from Pfizer and 5 from Wyeth).
m  Reiterate Buy: We have maintained our EPS estimates for FY12 and for FY13.  We expect the company to benefit from good growth of its brands, launch of new products in the domestic market and expected merger of Wyeth. At the CMP of Rs1224, the stock trades at 18.8x FY12E EPS of Rs65.2and 15.7x FY13E EPS of Rs78.0. We reiterate Buy with a target price of Rs1483 (based on 19x FY13E EPS).


Thanks & Regards, 

Sterlite Technologies Operational efficiencies yet to come HOLD ::Emkay

Please Share:: Bookmark and Share India Equity Research Reports, IPO and Stock News
Visit http://indiaer.blogspot.com/ for complete details �� ��


Sterlite Technologies
Operational efficiencies yet to come


HOLD

CMP: Rs38                                        Target Price: Rs34

n     Revenue at Rs6.6bn, up 14.6% yoy (our est. of Rs7.3bn). EBITDA at Rs522mn grew 21.2% yoy with EBITDA margin at 7.9%. Telecom margin declined 830bps yoy to 15.9%
n     PAT at Rs94mn was down 44.6% yoy (our est. of Rs120mn), led by Rs66mn of interest & depreciation due to merger of ‘Sterlite Infra-Tech Ltd’ (wholly owned subsidiary)
n     Cut EBITDA by 27.1%/ 8.9% for FY12E/13E due to continued margin pressure in telecom segment pertaining to capacity expansion
n     Maintain HOLD with revised TP of Rs34 (earlier Rs47). Valuation at 28.4x and 9.0x on our EPS estimate of Rs1.3/4.2 for FY12E/13E 

BSE, Bulk deals, 30/1/2012

Please Share:: Bookmark and Share India Equity Research Reports, IPO and Stock News
Visit http://indiaer.blogspot.com/ for complete details �� ��


Deal DateScrip CodeCompanyClient NameDeal Type *QuantityPrice **
30/1/2012531560Aroma EnterprisesAASHISH DEVELOPERB32000013.95
30/1/2012531560Aroma EnterprisesKANCHANBHAI BALDEVBHAI PATELS14500013.95
30/1/2012531560Aroma EnterprisesKANDARP KANCHANBHAI PATELS8300013.95
30/1/2012531560Aroma EnterprisesNISHITH BABULAL SHAHS8380013.95
30/1/2012590114Arunjyoti EnterprisesANUPAM NARAIN GUPTAB3000027.08
30/1/2012590114Arunjyoti EnterprisesPURAN CHAND CHOUDHARYB3000026.98
30/1/2012590114Arunjyoti EnterprisesVENKAT NARESH MAJETIS3250026.96
30/1/2012532435Asia HR TechSANJAY KANAYALAL MAKHIJAB500005.50
30/1/2012532435Asia HR TechKAMAL KANAYALAL MAKHIJAB500005.50
30/1/2012532435Asia HR TechHARESH KANAYALAL MAKHIJAB500005.50
30/1/2012532435Asia HR TechDINESH KANAYALAL MAKHIJAB500005.50
30/1/2012532435Asia HR TechKHYATI ATULBHAI PATELB500005.50
30/1/2012532435Asia HR TechNITA KAPIL BHUPATANIB500005.50
30/1/2012532435Asia HR TechKUNAL ZAVERILAL DEDHIAB500005.50
30/1/2012532435Asia HR TechM SARASWATHYS4000005.50
30/1/2012509053Banas FinancePONDURAIS70750055.17

NSE, Bulk deals, 30-Jan-2012

Please Share:: Bookmark and Share India Equity Research Reports, IPO and Stock News
Visit http://indiaer.blogspot.com/ for complete details �� ��


DateSymbolSecurity NameClient NameBuy / SellQuantity TradedTrade Price /
Wght. Avg.
Price
Remarks
30-Jan-2012BARTRONICSBartronics India LimitedVAIBHAV DOSHI STOCKS AND COMMODITES PRIVATE LIMITEDBUY1,85,66439.99-
30-Jan-2012BARTRONICSBartronics India LimitedVAIBHAV DOSHI STOCKS AND COMMODITES PRIVATE LIMITEDSELL1,85,66440.20-
30-Jan-2012CREWBOSCrew B.O.S. Products LimiAJAY ASSET MANAGEMENT PRIVATE LIMITEDBUY83,62334.39-
30-Jan-2012CREWBOSCrew B.O.S. Products LimiAJAY ASSET MANAGEMENT PRIVATE LIMITEDSELL82,82034.44-

30/1/12: Turnover (BSE) (Rs. crore) Clients NRI Proprietary Trade Data

Please Share:: Bookmark and Share India Equity Research Reports, IPO and Stock News
Visit http://indiaer.blogspot.com/ for complete details �� ��


Categories Turnover (BSE)
(Rs. crore)
ClientsNRIProprietary
Trade DateBuySalesNetBuySalesNetBuySalesNet
30/1/121,719.651,615.98103.670.551.18-0.63569.88593.46-23.59
27/1/121,697.451,783.33-85.880.671.68-1.01617.63596.8420.79
25/1/121,784.501,813.87-29.371.232.69-1.46679.42643.0436.38
Jan , 1233,138.7933,344.17-205.3816.0019.47-3.4711,301.6710,987.64314.03
Since 1/1/1233,138.7933,344.17-205.3816.0019.47-3.4711,301.6710,987.64314.03

FII DERIVATIVES STATISTICS FOR 30-Jan-2012

Please Share:: Bookmark and Share India Equity Research Reports, IPO and Stock News
Visit http://indiaer.blogspot.com/ for complete details �� ��


FII DERIVATIVES STATISTICS FOR 30-Jan-2012 
 BUYSELLOPEN INTEREST AT THE END OF THE DAY 
 No. of contractsAmt in CroresNo. of contractsAmt in CroresNo. of contractsAmt in Crores 
INDEX FUTURES421451077.31874262232.2544652111322.06-1154.94
INDEX OPTIONS3384228573.543020427677.47118026230001.66896.07
STOCK FUTURES558771482.93599951642.6896330625751.51-159.74
STOCK OPTIONS21394579.7921602583.9930471809.74-4.20
      Total-422.81


-- 

30/1/12: FII & DII Turnover (BSE + NSE) (Rs. crore)

Please Share:: Bookmark and Share India Equity Research Reports, IPO and Stock News
Visit http://indiaer.blogspot.com/ for complete details �� ��


FII & DII Turnover (BSE + NSE)
(Rs. crore)
FIIDII
Trade DateBuySalesNetBuySalesNet
30/1/122,575.352,777.06-201.71772.391,306.08-533.69

Trade Date Category (30 Jan)

Please Share:: Bookmark and Share India Equity Research Reports, IPO and Stock News
Visit http://indiaer.blogspot.com/ for complete details �� ��


Trade DateCategoryBuy Value in Rs.CroresSell Value in Rs.Crores
30-Jan-12Mutual Funds109.55158.31-48.76
30-Jan-12Proprietory Trades32097.5232588.32-490.80
30-Jan-12Others32353.2631390.89962.37
Notes :
1.  Buy / Sell value at the end of day:
     Options Value (Buy/Sell) = Strike price * Qty
     Futures Value (Buy/Sell) = Traded Price * Qty
2. Others exclude FIIs, Mutual Funds, Proprietory Trades